Melkior Resources Inc. (“Melkior” or the “Company”) (TSXV:MKR) (OTC:MKRIF) is pleased to announce it has reevaluated its geochemical data, following a till survey completed on the Maseres Property during the summer (see news release dated July 9th, 2020). The till survey was conducted to confirm previously known soil sample anomalies defined in 2019 by the Company. The survey includes the SW area from the previously drilled targets (see news release dated April 25th, 2019), and the new interpretation is shown in Figure 1. The re-interpretation of the 2019 soil results and 2020 till sample results indicate a possible source of mineralization on the Property, just up-ice from the previously drilled locations. The Company will begin a drill program in early January 2021 before drilling its Val d’Or East Property.
Figure 1. New Interpretation of the Source of the Anomalies in Till and Soils
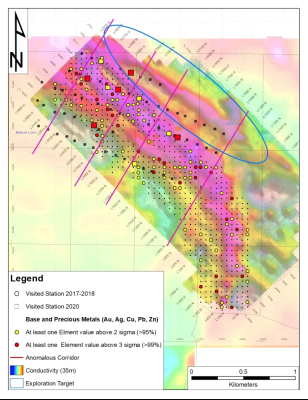
Jonathon Deluce, Chief Executive Officer of Melkior Resources, commented: “The re-interpretation of the previous soil samples and 2020 till samples provide a renewed theory on our A Block target shown in Figure 1. While the previous drill program focused on the IP targets under the strong soil results, we believe that the potential source of the Au, Ag, Zn anomalies are “up-ice” and along the structure further to the north-east. A drill program is currently being designed to commence in January. Investors have numerous catalysts to track for the next quarter:
Results from Kirkland Lake Gold’s maiden (as operator) 3,800M program at Carscallen (Results expected Dec – Feb 2021)
Drill program at Maseres to test re-interpreted targets (January 2021)
Maiden drill program at Val D’Or (February 2021)
The re-interpretation of the data also defined multiple areas of interest for VMS mineralization as being the source for multiples polymetallic (Ag, Cu, Zn) anomalies in glacial dispersal trends. Widespread and well-correlated anomalies in silver and zinc indicate that similar mineralization to the one previously discovered during drilling (19g/t Ag and 1.74% Zn) could explain the type of mineralization to expect at the source of the anomalies. The Company will complete ground exploration work to observe if mineralized blocks can be found at the surface near the expected source of anomalies and follow up with local geophysics. Figures 2 and 3 show the distribution of the anomalies for silver and zinc.
Gold anomalies are found on the A, B, and D blocks. Figures 2 and 3 show the distribution of the anomalies for silver and zinc. Figure 4 shows the gold trends on the Property.
Figure 2. Silver Anomalies in Soil and Till
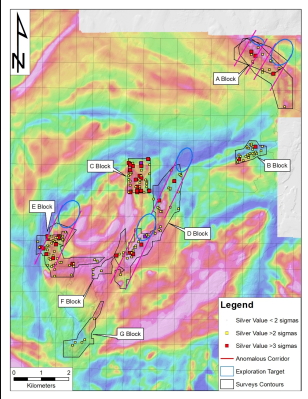
Figure 4. Gold Anomalies in Soil and Till
Methodology
The purpose of this survey was to confirm the anomalous glacial vectors previously identified in the historical soil samples and to extend up-ice the surveys until it covered the possible source; and if possible, identify the host lithology in boulders and pebbles from sampling pits.
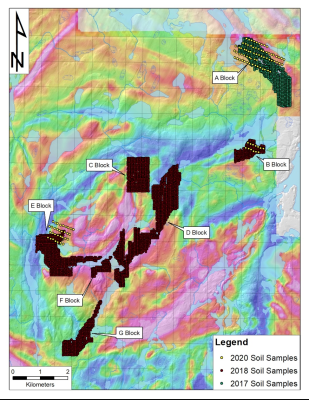
108 soil samples were collected during the 2020 survey, including 70 samples on the A Block, 13 samples on the B Block and 33 on the E Block. The samples consisted of B-Horizon till samples and weighted approximately 1kg each. Figure 5 shows the location of the samples.
Figure 5: Sample Location
The samples were sent to ALS Laboratory in Val d’Or and tested using the AuME-TL44 assaying protocol, which consists of the assaying of Au and 46 other elements by aqua regia extraction with ICP-MS finish on a 50 grams sample.
A geochemical assay results retreatment of the 2017-2018-2020 samples to extract additional information has been conducted. Two sets of maps were produced: One consisting of simply extracting the values greater than 2 sigmas deviation (95%-98%) and greater than 3 sigmas (>99%) values for gold, silver, copper, and zinc (figures 2-3-4-5). The second set was for trace elements and consisted of attributing a grade index value to selected elements and plotting the sum of these grade indexes on maps (Figures 6-7-8). The grade index value is calculated by attributing a value of 4 if the selected value is greater than 3 sigmas deviation (top 99%); a value of 2 if within 2 sigmas deviation (95%-99%); a value of 1 if within 1 sigma deviation (68%-95%), and a value of 0 if smaller than 1 sigma (<68%).
Qualified Person
This press release was prepared by Steven Lauzier, P.Geo,OGQ and by Pierre-Alexandre Pelletier, P.Geo OGQ, who are qualified persons as defined under National Instrument 43-101, and who reviewed and approved the geological information provided in this news release.
ON BEHALF OF THE BOARD
Jonathon Deluce, CEO
For more information, please contact:
Melkior Resources Inc.
E-mail: [email protected]
Tel: 226-271-5170